Honest, data-driven analysis of where the market is moving—and how to make your move with confidence.
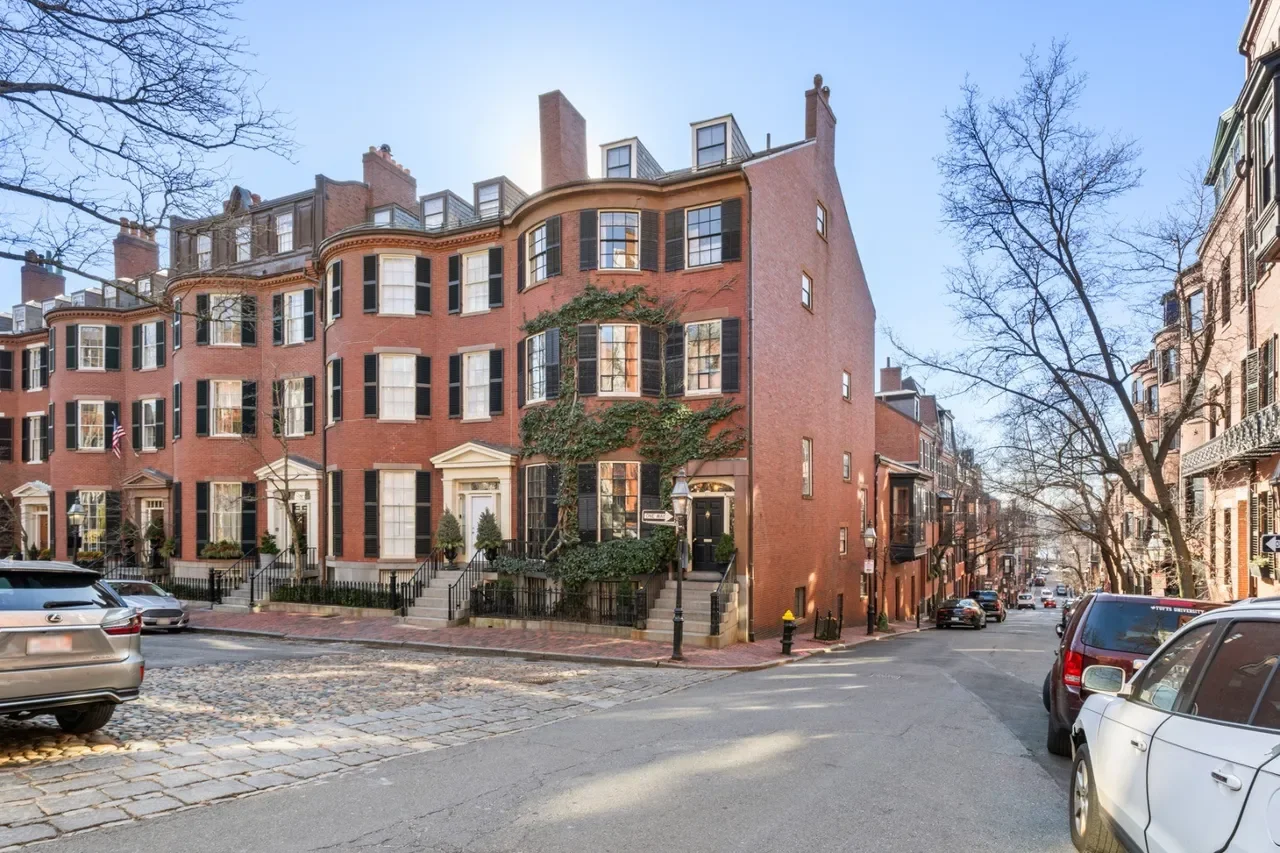
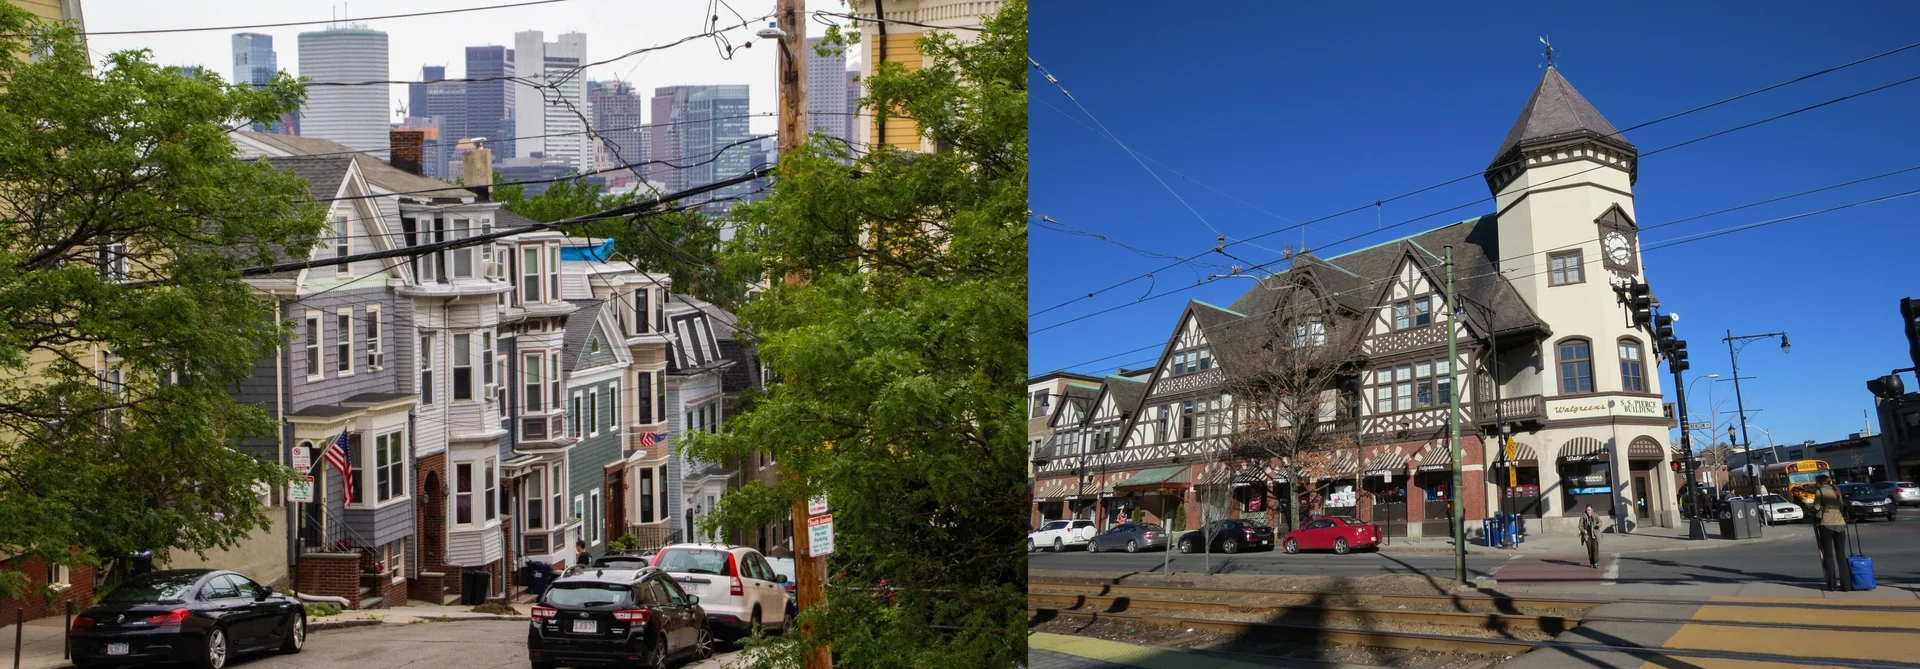
Mortgage rates near 5.75% cool bidding wars. Compare a Back Bay/South End condo vs. a larger Charlestown/West Roxbury/Dorchester home at $1.5M.
Southie sells in ~33 days while Back Bay lingers near ~64. Learn what this means for buyers—speed vs price, leverage, and tactics to win.
Boston’s luxury condo glut is cooling prices while Brookline’s extreme scarcity drives a +21.9% jump. See what it means for buyers and owners in 2026.
National inventory is up, but Greater Boston still has almost no $500K move-in-ready single-family homes. See what to buy instead in 2026.
In Boston’s Feb 2026 market, leased solar panels can act like a $20K–$30K encumbrance—adding friction, scaring buyers, and dragging offers down.
63.5% of Boston-area homes are selling under ask in Feb ’26. Learn what’s driving it—and how to price (or buy) without a bidding war.
A 3% rent cap could make 38% of projects infeasible—erasing 16,629 future units and worsening Boston’s housing crunch. See the math.
Boston inventory is tight, but 2026 leverage is in re-listed condos after late-2025 failures. Learn how to spot shadow inventory and negotiate.
Mortgage rates follow bonds, not Fed headlines. Boston condo inventory is up—use today’s buyer strike to negotiate price, inspections, and credits.
Rent control and new landlord rules may push tired owners to sell. See why Class B multifamily could offer rare leverage for Boston investors.
Boston college housing choice: compare rent sunk costs vs condo equity, down payment barriers, walkability, and 3–4 year exit strategy.
Boston’s condo market has shifted: inventory up 57% and longer days on market. See why buying may beat renting—and how to negotiate smarter.