
# Velocity Trap: Why South Boston's Speed is Harder Than Back Bay's Price
Quick Summary: Key Takeaways
•The Myth: The hardest market to buy in is always the most expensive one (Back Bay).
•The Reality: South Boston is functionally more difficult for buyers due to the "Velocity Trap." While Back Bay requires more capital, South Boston requires extreme speed, with homes receiving offers in just 40 days compared to Back Bay's 105-day average.
•The Bottom Line: If you are buying a condo in Boston today, you must choose your stress: the financial barrier of Back Bay or the decision-fatigue of South Boston's sprint.
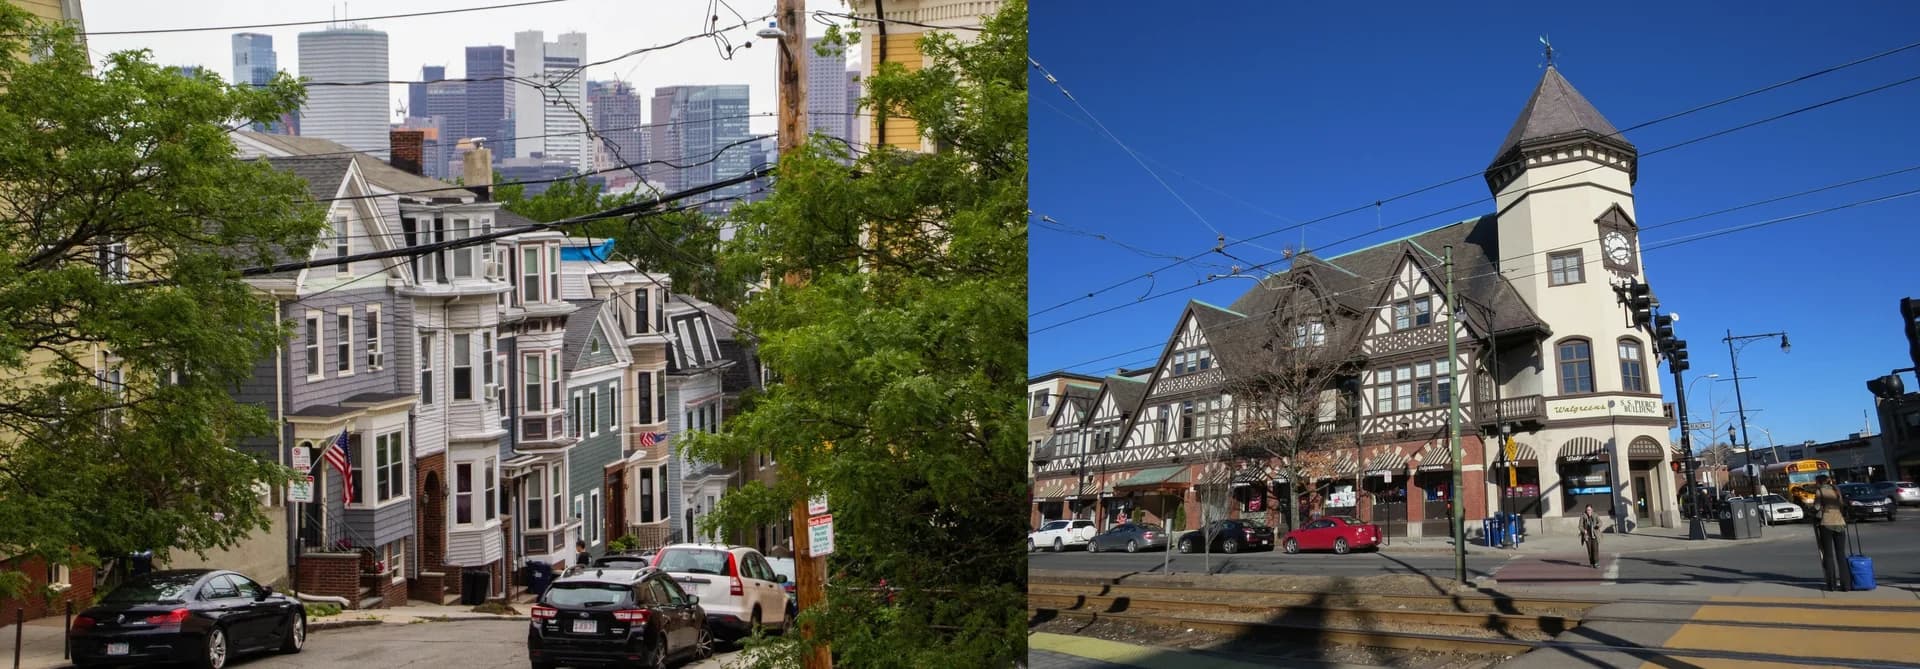
As we close out February 2026, the Boston real estate market has split into two very different buyer experiences.
In Back Bay, the challenge is obvious: price and carrying costs.
In South Boston, the challenge is sneakier—and often harder in practice: speed.
If your core question is, "South Boston vs Back Bay: which market is actually harder for buyers?" the most useful answer is this: South Boston is usually harder to execute, while Back Bay is harder to qualify for.
What is the "Velocity Trap"?
The "Velocity Trap" happens when a neighborhood's pace accelerates so dramatically that your normal due diligence window essentially collapses.
You don't get time to digest the HOA docs, schedule a second showing, line up contractor quotes, or negotiate repairs. Instead, you're forced to make a six- or seven-figure decision on a compressed timeline.
That's not just stressful—it gets expensive. Rushed decisions are where buyers overbid, waive protections, or miss building-level red flags.
South Boston Market Snapshot (Dec 2025)
Headline MLS indicators for South Boston (02127) with mixed units, best presented as a snapshot card.
Pricing
Average Sale Price$935,228
Market Pace
Average Days to Offer40 days
Negotiation
List-to-Sale Price Ratio97%
Sales & Pipeline
Listings Sold32 properties
Under Agreement11 properties
Price Reductions
Price-Changed Listings10 listings
Avg total price adjustment-1.74%
Average dollar reduction-$19,390
The snapshot above reveals the "speed tax": South Boston's Average Days to Offer is ~40 days, dramatically tighter than what you see in Back Bay's luxury tier.
In Southie, you don't just need a budget—you need a plan that works fast. The market punishes hesitation.
How Fast is South Boston Actually Moving?
If you're shopping in 02127, you're not imagining the intensity. South Boston behaves like a high-velocity engine: plenty of buyers, limited "A" inventory, and a strong preference for clean, confident offers.
The Sprint: 02127 By The Numbers
•Days to Offer: ~40 days.
•List-to-Sale Ratio: 97% (sellers are getting close to ask).
•Inventory Turnover: High. With 32 properties sold and 11 under agreement in the reporting period, listings are getting absorbed quickly.
A 97% list-to-sale ratio means "discount shopping" is rarely the winning strategy. Your leverage usually comes from being simpler—financing certainty, flexible timing—not from being aggressive on price cuts.
Here's the uncomfortable truth: in a fast market, the home you like can still be the home you lose, unless your financing and paperwork are ready before you tour.
The Insight: In South Boston, you pay with stress. The difficulty lies in the lack of contingency time. Waived inspections and rapid-fire offers are the norm to compete in a 40-day cycle.
Is Back Bay Really a "Buyer's Market"?
Not automatically—but relative to South Boston's pace, Back Bay can feel calmer, especially in the upper-end condo segment.
Right now (late winter 2026), we continue to see signs of a Boston condo glut at the high end—particularly above $3M. That doesn't mean prices crash overnight. It means the buyer often gets something rare in Boston: time.
Time to review condo budgets and reserves, negotiate repairs or credits, run comps carefully, and push back on terms.
Median Home Price by Boston Neighborhood (Dec 2025)
Single-metric comparison of neighborhood median home prices (all values in USD).
Back Bay's median price is $2,374,000 versus South Boston's $1,205,000—but the practical difference for many buyers is the timeline.
The Lull: 02116 By The Numbers
•Median Price: $2.37M
•Average Days on Market: 105 days
•Negotiation Power: Higher than in Southie, because longer DOM creates more seller sensitivity to price, terms, and certainty.
A 105-day average DOM often translates into real negotiating leverage—price improvements, closing credits, or simply the ability to keep key contingencies that would get you rejected in a faster zip code.
The "hard" part of Back Bay is emotional in a different way: when a segment softens, buyers worry about overpaying. But if you're an end-user (not flipping), that softness can be a feature—because it buys you due diligence and leverage.
South Boston vs. Back Bay: The Data Head-to-Head
Here's the side-by-side comparison. This is where the "harder" question becomes clearer, because "hard" can mean fast, expensive, or both.
Data Table
| Metric | South Boston (02127) | Back Bay (02116) | Citywide Average |
|---|---|---|---|
| Median Home Price | $1,205,000 | $2,374,000 | $899,000 |
| Price per Sq. Ft. | $966 | $1,444 | $861 |
| Avg. Days on Market | 69 Days | 104 Days | 82 Days |
| Market Velocity | High (Sprint) | Low (Lull) | Moderate |
| Walk Score | High | 96 (Elite) | Varies |
Note: While "Days to Offer" in South Boston is ~40 days, the total "Days on Market" (until closing) averages 69 days, still significantly faster than Back Bay's 104 days.
Homes: Average Days on Market by ZIP (Boston Area)
ZIP-by-ZIP comparison on a single metric (days). MoM/YoY changes are excluded to keep units consistent.
Even if you're seeing "69 days" for South Boston DOM, the competitive decision point is earlier—when offers are made. That's why Southie feels hard: your risk decisions get pulled forward.
Are Home Prices Going Up or Down in 2026?
This matters because the "hardness" of a market isn't just the purchase—it's what happens after you buy.
The current pattern remains a split: scarcity keeps single-family strong, while condos—especially higher-end condos—show more price sensitivity.
Single-Family vs Condo Median Prices (Boston): Last June vs May vs Current
Multi-series view showing how median prices moved across three stated reference points for each property type (all USD).
Last June
May
Current
•Single-Family Homes: Median prices have risen to $1,003,250, up 4.5% year-over-year.
•Condos: Median prices have softened to $725,000, down 3.3% year-over-year.
If you're buying in Back Bay (mostly condos), the softening condo trend can work in your favor at the negotiation table—but it also means you should be extra disciplined on valuation, HOA financial health, and resale appeal.
In South Boston, where demand remains intense for "livable" product in a lower (relative) price band, the competition can keep pricing firm—even when the broader condo category is soft.
The Verdict: Which Market is Actually Harder?
It depends on what kind of "hard" you mean—and what your life can tolerate right now.
The Winner for "Hardest to Execute": South Boston
If "hard" means speed, competition, and decision fatigue, South Boston is the tougher market for most buyers.
•Pros: Lower entry price (about $1.2M median), strong lifestyle demand, high walkability.
•Cons: The ~40-day offer clock (and often less in practice on the best listings).
•Strategy: Compete on certainty. Get fully underwritten (not just pre-qualified), pre-read condo doc requirements with your lender/attorney, and decide in advance what you will and won't waive.
The better prepared buyer doesn't just win more often—they also avoid "panic terms" that can cost you later.
The Winner for "Hardest to Afford": Back Bay
If "hard" means the financial barrier, Back Bay is still the heavyweight.
•Pros: The luxury of time (about 105 days DOM), more negotiation room, less pressure to waive protections.
•Cons: High entry cost ($2.37M median), often meaningful HOA fees, and more short-term pricing friction in luxury condos.
•Strategy: Use the calendar. Focus on listings sitting 90+ days, track price-change history, and negotiate with data—not vibes.
In Back Bay, you're often paying more—but you can also buy with fewer regrets because you have time to inspect, verify, and negotiate properly.
What should you do next if you're deciding between South Boston and Back Bay?
If you tell me your target budget range, whether you need parking/outdoor space/elevator, and your ideal move timeline (30/60/90+ days), I can map out which neighborhood is likely to be "hard" for you—and what offer strategy fits (including how aggressive you actually need to be on terms).
If you want, send me your price range and must-haves, and I'll reply with a South Boston vs Back Bay buyer game plan tailored to your situation—including which buildings/blocks tend to be the biggest velocity traps.