I'm Andrew Goldberg, a Boston real estate advisor specializing in first-time buyers across Greater Boston. I guide you A to Z—from first search to closing day. Serving Boston, Brookline, Cambridge, Medford, Somerville and Newton, MA.
Key Takeaways: The February 2026 Market Reality
•The Myth: You can still find a "starter home" for under $500k if you just look hard enough or wait for spring inventory.
•The Reality:Greater Boston single-family under 500k is a statistical anomaly. The median single-family price has stabilized north of $1M, and inventory remains critically low despite national gains.
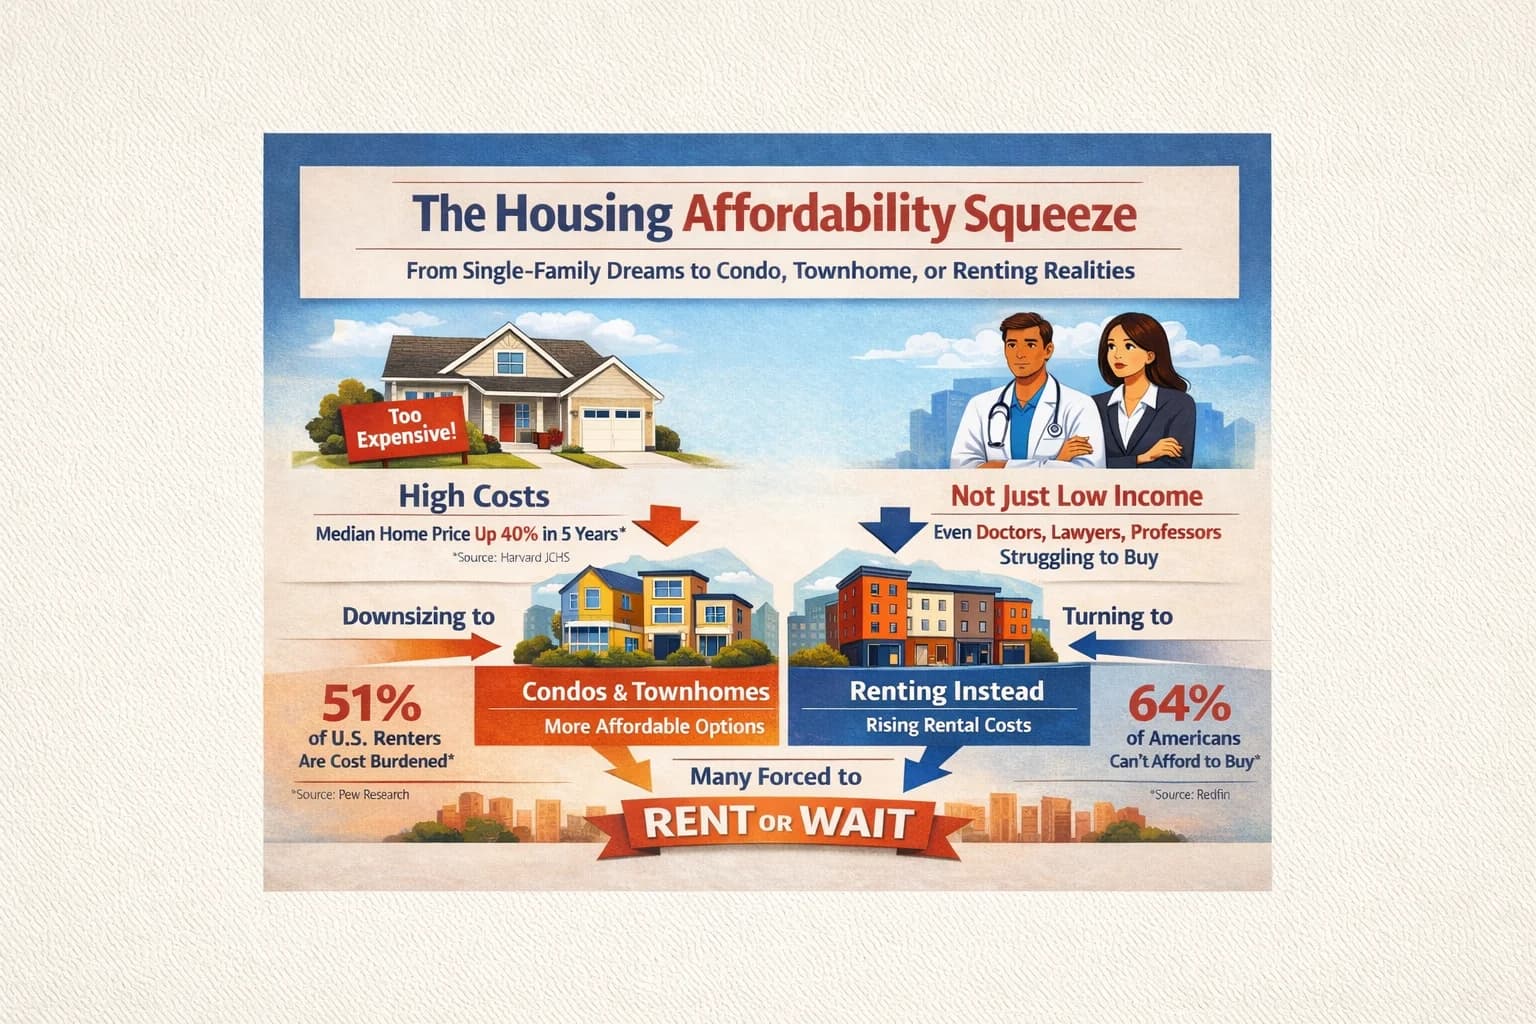
•The Bottom Line: Even high-income earners (doctors, MIT/Harvard PhDs) are pivoting to condos, townhomes, or the 495 belt. If your budget is capped at $500k, you must adjust your asset class or your geography immediately.
*
Why Does the News Say Inventory is Up When I Can't Find a House?
If you're feeling like the headlines are gaslighting you, you're not imagining it.
As we sit here in February, 2026, national coverage keeps pointing to "more inventory"—often cited as nearly 20% higher year-over-year. But that's a broad U.S. story, not the Greater Boston story.
Boston real estate is brutally local.
Most of those new listings are showing up in markets that can expand outward easily: the Sun Belt, parts of the Midwest. Here, the constraints are structural. Limited land. Restrictive zoning. Persistent demand tied to jobs, universities, and hospitals.
What does that mean for you? Even if the country has more homes "for sale," the number of homes that are actually buyable at a $500K budget in Greater Boston remains close to zero.
U.S. Housing Affordability: Key Headline Numbers
A quick-read card combining the most cited affordability and market indicators (mixed units: %, $, counts).
Renter cost burden (JCHS, 2022)
Share of renters cost burdenedhalf of all US renters
Cost-burden thresholdmore than 30%
Cost-burdened renter households22.4 million
Inventory & pricing (Realtor.com)
National median list price$399,900
Active listings YoY change10%
Rates (Freddie Mac)
Avg 30-year fixed mortgage rate (late Oct 2024)6.54%
The chart above confirms it. Active listings nationally may be up, but in Greater Boston, affordability is still getting squeezed by the combo of high prices and mortgage rates hovering around ~6.09%.
For a $500K buyer, "inventory is up" doesn't help if the new inventory is priced at $800K–$1.2M. That inventory might as well not exist.
Who is Actually Getting Priced Out of the Market?
It's not just first-time buyers with modest incomes.
One of the biggest misunderstandings in 2026 is that Greater Boston's affordability problem only hits "entry-level" households. The market has crept into territory where even traditionally comfortable earners are hitting a wall.
In my recent analysis of client profiles across the Greater Boston area, a startling trend has solidified. We are seeing families who would traditionally be considered "upper-middle class"—MIT PhDs, lawyers, and medical doctors—hitting a hard wall.
These are not buyers with credit issues. These are high-earners who are finding that their salaries cannot outpace the appreciation of the Boston real estate market 2026.
"I've had many families looking for single-family homes that had to switch or pivot to condo/townhomes or rent as affordability has become a major issue. It's not just low-income folks; MIT PhDs, lawyers, and doctors are also facing an affordability issue... they too are considering condos, townhomes, or just giving up and renewing their lease."
That's the lived experience behind the numbers.
Share of Listings Affordable by Household Income (March 2025)
Single-metric comparison showing how sharply affordability improves with income—yet remains limited for middle-income buyers.
Single-metric comparison showing how sharply affordability improves with income—yet remains limited for middle-income buyers.
When the data shows that even $100,000+ households can access less than 40% of the market—and less when you isolate for Greater Boston—that's the definition of a "shifted" market.
If six-figure households are struggling to land a single-family home, a $500K cap doesn't just put you at a disadvantage. It puts you in a different game entirely.
Why Is Route 128 So Expensive Right Now?
Because Boston can't build its way out of demand—at least not quickly, and not in the towns most buyers want.
Greater Boston is constrained by geography (water, dense development patterns), zoning and permitting friction, and intense demand anchored by employment and institutions.
Right now, the Boston months of supply sits around ~1.6 months. A balanced market is roughly 6 months.
With 1.6 months of supply, you're not "shopping." You're competing. And in competition, prices don't politely stay under $500K just because a buyer needs them to.
Here's how Greater Boston compares with the national picture:
Data Table
Metric
National Average
Greater Boston (Core)
Implication
Median Single-Family Price
~$400,000
~$1,065,000
Boston is 2.5x the national cost.
Months of Supply
~3.5 Months
1.6 Months
Extreme competition for every listing.
Inventory Trend (YoY)
UP ~20%
DOWN ~4.3%
The region is defying the recovery.
This isn't just "our feeling." The metro-level categorization below puts Boston in the camp where supply is not catching up.
How 100 Largest U.S. Metros Are Classified vs a Balanced Market
Part-to-whole breakdown of metro market status categories across the 100 largest metro areas (sums to 100%).
TOTAL
Getting closer to balance
30%
Stuck in the middle
44%
Falling further behind
26%
Part-to-whole breakdown of metro market status categories across the 100 largest metro areas (sums to 100%).
When inventory trends are falling locally while demand stays strong, the market doesn't "open up" for $500K single-family buyers—it tightens.
Can I Just Buy a Fixer-Upper for Under $500k?
You can try—but in 2026, this plan has more hidden math than most buyers expect.
The old playbook was: buy ugly, renovate, build equity. That can still work, but the "easy wins" are mostly gone in and around Route 128.
Two problems keep showing up:
1) The move-in-ready premium is massive.
Turnkey homes attract buyers who can't (or won't) manage renovations—often the same high earners you're already competing against.
2) Construction costs can turn a "deal" into a trap.
If you buy at $450,000 and the realistic renovation scope is $150,000, you're effectively at $600,000, before carrying costs, surprises behind walls, and timeline stress.
A fixer doesn't automatically solve the affordability issue—it can simply shift the pain from "price" to "cash required" and "risk tolerated."
Year-over-Year Change in Price per Square Foot by Region
Regional snapshot of where home prices (per sq ft) are rising or easing most recently.
Regional snapshot of where home prices (per sq ft) are rising or easing most recently.
Price-per-square-foot pressure in the Northeast has stayed stubborn, even as some other regions cool.
When $/sf stays high, you don't get "rescued" by a smaller or older home the way buyers did in prior cycles.
Should I Buy a Condo or Move Further West?
This is the real decision point if your budget is capped at $500K.
If the $500K single-family is nearly extinct in the inner suburbs, your lever becomes a choice between Asset Class vs. Geography.
Option A: The "Townhome" Pivot
Townhomes have become the practical bridge for buyers who want a more residential feel than a typical condo, more usable space for the money, and (often) less "luxury building overhead" than high-amenity condo towers.
This is frequently the fastest way to stop renting and start building equity without needing a 60–90 minute commute.
Option B: The "495 Belt" Migration
To get a true single-family near $500K, many buyers push outward—sometimes beyond what they originally considered reasonable.
The "drive until you qualify" trend is real.
You may get the yard and the driveway, but you're typically paying in time (commute), car dependency, and sometimes fewer walkable amenities.
The Trade-Off Matrix:
Data Table
Feature
Condo/Townhome (Inner Ring)
Single-Family (Outer Ring/495)
Commute
< 45 Mins
60+ Mins
Walkability Score
High
Low / Car-Dependent
Maintenance
Low (HOA managed)
High (Owner managed)
Appreciation
Steady
Rapid (Catch-up growth)
The affordability squeeze shows up clearly when you isolate what's available to middle-income households.
Listings Within Reach for $75k–$100k Households (Share of Listings)
Time-series view of how affordability for the $75k–$100k income bracket has shifted relative to a balanced-market benchmark.
TOTAL
2019
48.8%
March 2024
20.8%
March 2025
21.2%
Balanced-market benchmark
48.1%
Time-series view of how affordability for the $75k–$100k income bracket has shifted relative to a balanced-market benchmark.
If you keep searching for an inner-ring single-family under $500K, you're often spending months (or years) on a search that the data says is structurally unlikely to succeed.
Is It Better to Buy Now or Wait for Rates to Drop?
Waiting can feel logical—especially if you're hoping a rate drop will make monthly payments easier.
But in Greater Boston, the "wait for lower rates" strategy has a catch: lower rates typically increase competition.
As of Feb 12, 2026, mortgage rates have dipped to about 6.09%. If rates fall meaningfully (say, toward 5%), more buyers re-enter the market at once.
In a place with 1.6 months of supply, more buyers doesn't translate to better deals—it often translates to higher sale prices and more bidding wars.
The Verdict
If your budget is hard-capped at $500,000, stop hunting for unicorns in the single-family market inside (and many towns just outside) Route 128. You're competing with buyers who can stretch, pay cash, or absorb appraisal gaps.
Your Action Plan
1. Reset Expectations:Assessed Value is not Market Value. A home assessed at $480k can easily trade at $550k+ in a tight pocket.
If you're using assessed value to set your search filter, you'll keep getting disappointed.
2. Embrace the Condo/Townhome: Often the most realistic path to ownership and equity in the Greater Boston core.
This can get you stability (and a predictable housing payment) while the single-family segment stays out of reach.
3. Lock in What Works Today: If you find a home that fits your budget and lifestyle now, treat it seriously.
Boston's inventory shortage is structural—meaning a dramatic price correction is unlikely without a major economic shock.
$500K single-family homes in Greater Boston are almost a thing of the past—and for many neighborhoods, effectively gone already. The real question isn't whether you can "find the unicorn." It's how we position you to win something that actually exists in today's market.
If you tell me your target commute (minutes), must-have towns (or school priorities), and whether you'd consider a condo/townhome, I'll map out the most realistic $500K options—and show you which neighborhoods still have true inventory in that range.
Common Questions
What counts as “Greater Boston” when buyers talk about single-family homes under $500k?
Greater Boston usually means inside or near Route 128/95, where school districts, transit, and job density concentrate demand. In Boston housing inventory 2026, that geography has the lowest months of supply, so listings under $500k are rare and often smaller, dated, or located on less-desired streets.
How can a house be assessed near $480k but sell for $550k in the Boston area?
Assessments lag the market and are built for taxation, not pricing. In the Boston real estate market 2026, low supply and competitive bidding can push sale prices far above assessed values, especially for single-family homes. The gap widens when multiple offers, waived contingencies, or cash terms increase the effective bid.
Is it still possible to find a Greater Boston single-family under 500k without a teardown?
Greater Boston single-family under 500k exists, but it’s typically an edge case: very small square footage, functionally obsolete layouts, heavy deferred maintenance, or locations far from transit and top school clusters. In Boston housing inventory 2026, these homes often sell fast because they’re priced as “entry points,” not bargains.
Can a fixer-upper under $500k actually save money in the Boston market?
Fixer-uppers rarely save money once renovation and carrying costs are counted. In Boston housing inventory 2026, contractor availability, permitting timelines, and high labor/material pricing can turn a $450k purchase into a $600k+ total cost. Buyers also face appraisal gaps when post-renovation value doesn’t match cash invested.
Does “months of supply” really explain why listings feel impossible in Greater Boston?
Months of supply measures how long current listings would last at today’s sales pace. When it sits near 1–2 months, as seen in Boston housing inventory 2026, sellers control pricing and buyers compete aggressively. That’s why you can read “inventory is up” nationally yet still feel locked out locally.
Will waiting for mortgage rates to drop make it easier to buy in Boston in 2026?
Waiting can backfire because lower rates often increase buyer demand faster than sellers list homes. In the Boston real estate market 2026, supply constraints mean improved affordability can translate into higher sale prices and more bidding wars. Many buyers find the payment changes less than the price jump they trigger.