# Where Does $1M Buy the Most in Massachusetts in June 2026?
Key Takeaways
•Where $1M goes furthest: In June 2026, $1 million buys the most home in Western Massachusetts — in Hampden and Berkshire counties, where the average single-family home runs around $382,202 and $399,723, according to the Crawford Realty Team. That budget buys roughly 2.5 to 2.6 times the typical home there.
•Where $1M is barely entry-level: In inner-core Middlesex County, the average single-family home costs about $1,161,377. A million dollars lands you near or just below average — often a condo or a modest single-family.
•The trade-off: The east gives you walkability, transit, and fast resale. The west gives you space and lower taxes. Same dollar, two very different dreams.
•The bottom line: Compare counties on average price and yearly carrying costs — and always pressure-test a county number against the specific town, street, and listing before you buy.
Most people assume $1 million buys luxury anywhere.
In Massachusetts, that assumption breaks fast.
Put that budget in Cambridge, Newton, Brookline, Somerville, Medford, or Boston, and you may be shopping near the average — or below it. Move that same budget west toward Springfield, Pittsfield, Greenfield, or Northampton, and the picture changes entirely.
Same dollar. Radically different dream. As of June 25, 2026, county-level average prices from the Crawford Realty Team show a clear east-west split across Massachusetts.
So if you're asking, "Where does $1M buy the most in Massachusetts?" the answer is straightforward:
Western Massachusetts gives you the most space for the money. Inner-core Greater Boston gives you the strongest access, transit, schools, and resale demand.
The right choice depends entirely on what you need most.
Why Doesn't $1 Million Mean the Same Thing Everywhere?
A million-dollar budget only becomes useful when you break it into three parts:
1. Price — what homes typically cost in that area.
2. Space — how many square feet your money actually buys.
3. Taxes — your yearly property tax bill, which rises with home value.
The biggest difference is almost always space.
Statewide, the median listing price was $450 per square foot in May 2026 — down slightly from a peak of $453 in April.
Massachusetts Median Listing Price per Square Foot, Jan–May 2026
Monthly FRED series for Massachusetts median listing price per square foot, not seasonally adjusted.
Here's why that number matters.
At roughly $450 per square foot, a $1 million budget buys around 2,200 square feet on paper. But that's only if you're paying the statewide average. Per-square-foot prices vary sharply by city, so treat this as a baseline, not a city-specific figure.
In the inner core, you often pay more per foot — which means less house. In Western Massachusetts, you often pay less per foot, which means more rooms, more yard, and more flexibility.
Two recent policy changes also matter if you're shopping near this price point:
•The over-$1M transfer tax. As of November 1, 2025, Massachusetts real estate transfers over $1 million face a new transfer tax — a one-time cost paid when the property changes hands — according to Daniel Meyer in the New England Real Estate Journal. This hits hardest when your purchase price sits right at or above the $1 million line, which is far more likely in the inner core than in the west.
•Rent control is off the table. On June 23, 2026, the Massachusetts Supreme Judicial Court ruled that the rent control ballot question cannot appear on the November ballot, according to CBS Boston. For buyers weighing renting versus owning, the ownership math now carries even more weight.
As Governor Maura Healey put it: "I'm asking communities to support housing development. That's the way we're going to lower our costs."
The practical takeaway: don't judge affordability by price alone. Look at price, space, taxes, commute, and resale together.
Where Is $1M Basically a Starter Home?
The tightest part of the map is the inner-core Greater Boston market.
That includes the places buyers most often compare:
•Cambridge
•Brookline
•Somerville
•Medford
•Newton
•Boston
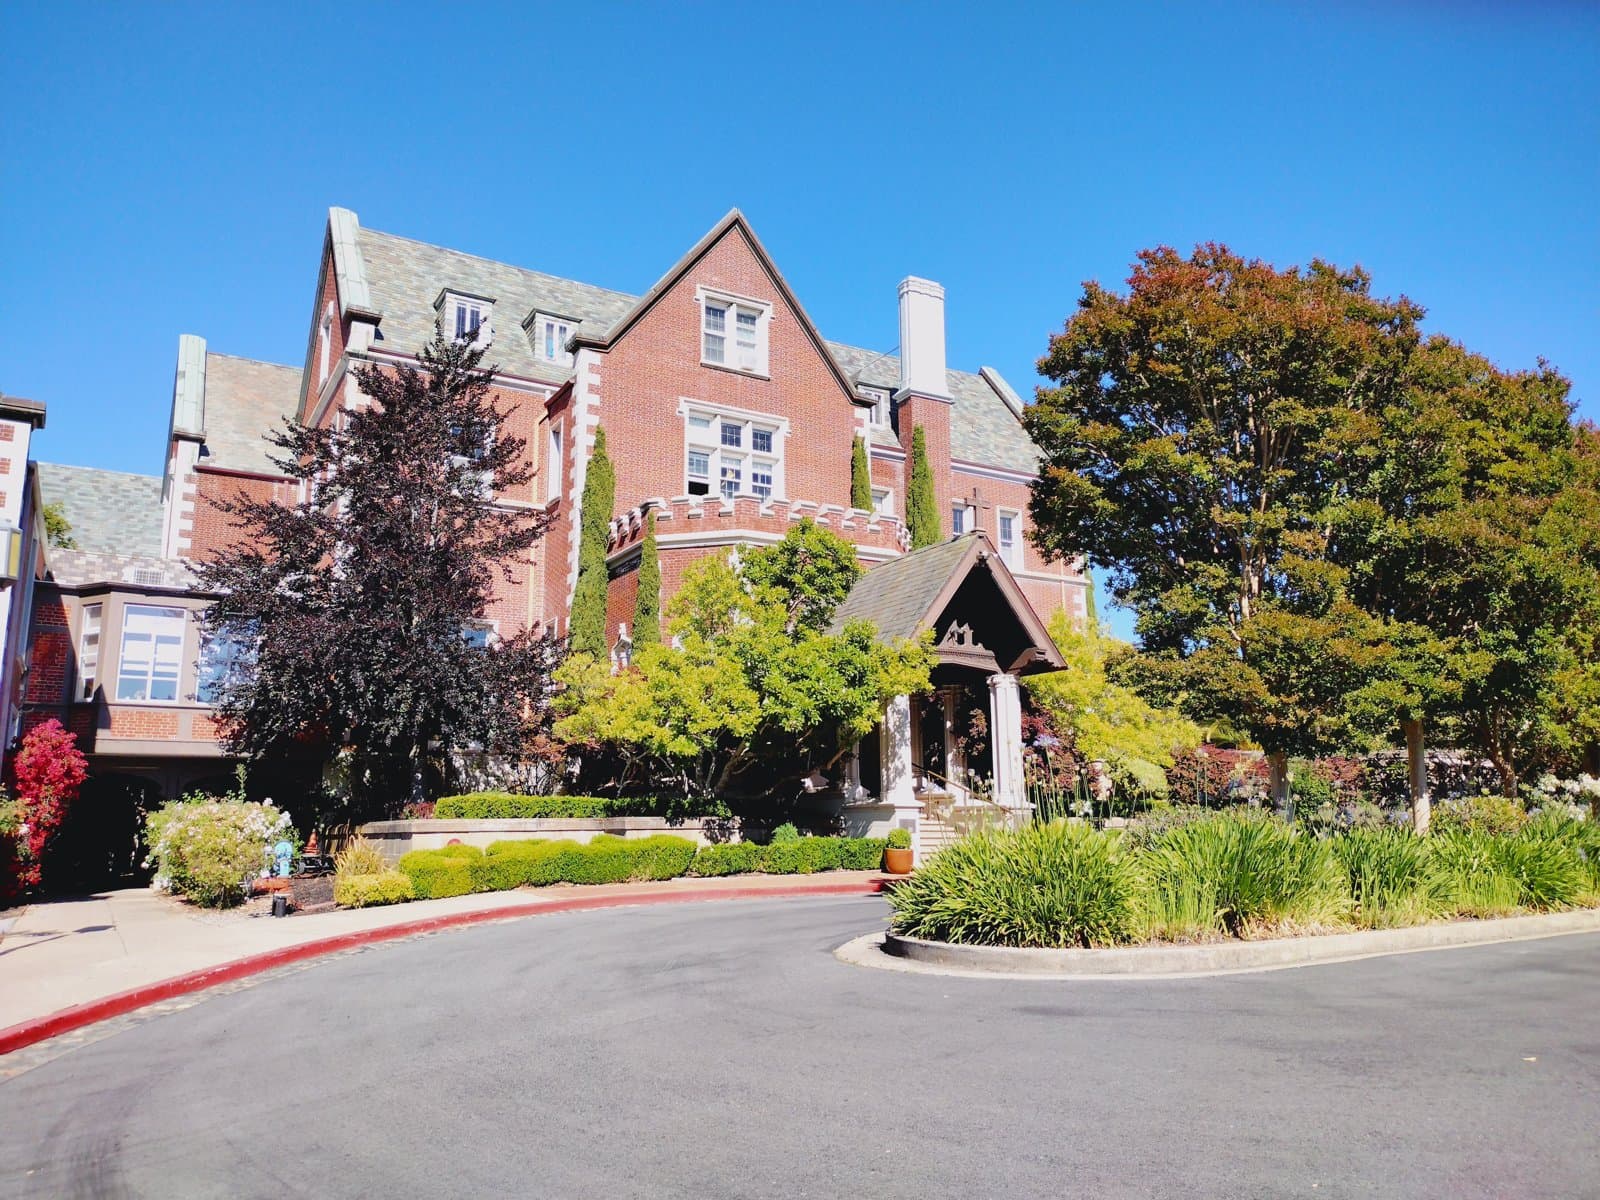
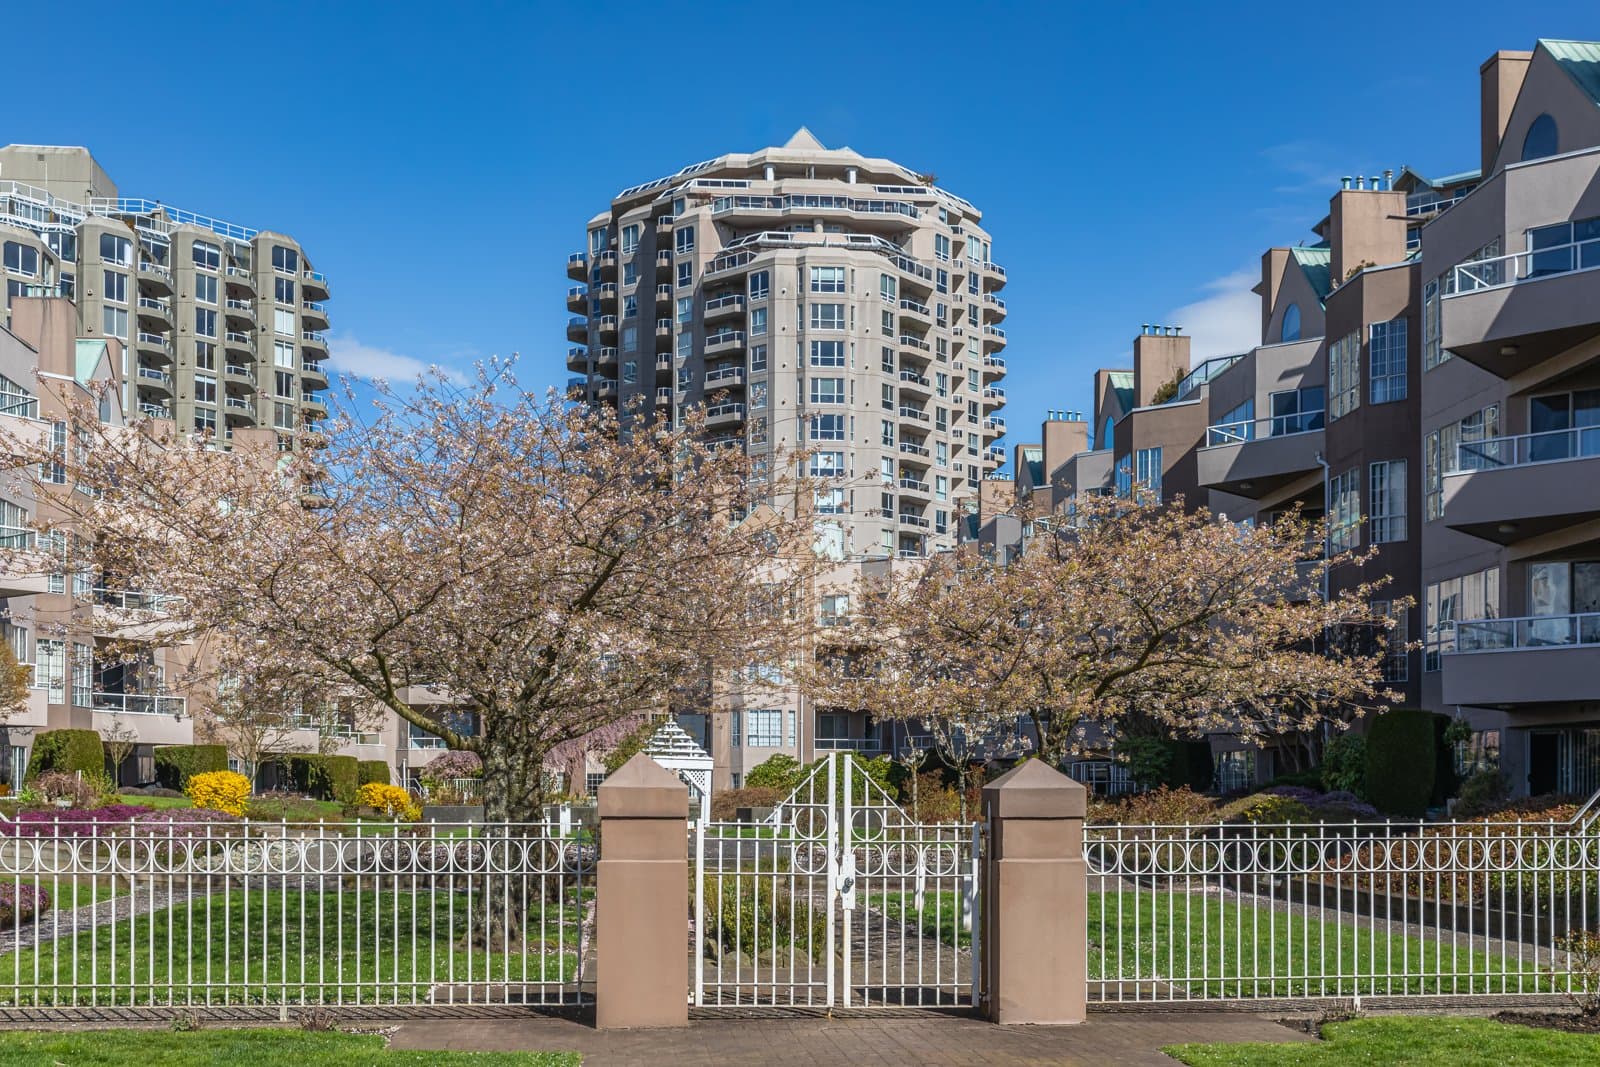
These areas command a premium because they deliver what many buyers want most — jobs, transit, schools, walkability, and resale strength.
In Middlesex County, which contains Cambridge, Newton, Somerville, and Medford, the average single-family home costs $1,161,377. A $1M budget lands you below average. Suffolk County, home to Boston, sits at $1,148,046. Norfolk County sits at $1,180,749 — the highest of the three. Norfolk includes pricier suburbs like Needham and Wellesley rather than the walkable, transit-rich cities at the center of this section, a reminder that even "inner-core" counties aren't uniform. In all three counties, $1M falls below the average single-family price.
Inner-Core County Average Single-Family Prices
Compares 2026 average single-family home prices in Norfolk, Middlesex, and Suffolk counties with what a $1 million budget buys in the Massachusetts inner core.
| Category | Avg. Single-Family Price (2026) | What $1M Gets You |
|---|---|---|
| Norfolk | $1,180,749 | Below average |
| Middlesex | $1,161,377 | Below average |
| Suffolk | $1,148,046 | Below average |
Source: Crawford Realty Team, Average Home Price in Massachusetts 2026.
What does that mean in practice?
A $1M budget in the inner core is often an entry ticket, not a trophy. You may be looking at a condo, a smaller single-family, or a property that needs real work.
But the trade-off can absolutely be worth it.
The inner-core advantages are real:
•Better walkability.
•Stronger transit access.
•Shorter commutes to Boston-area jobs.
•Highly rated school districts, including Newton Public Schools and the Public Schools of Brookline, both ranked among the state's best by Boston 25 News.
•Strong buyer demand when it's time to sell.
The drawbacks are equally real:
•Less space, almost universally.
•Higher property tax bills tied to higher home values.
•Intense competition.
•Less time to think when the right home appears.
Newton illustrates just how tight supply has been. As of December 2022 — the most recent Newton snapshot available — the city had just 101 homes listed for sale, nearly flat from 98 a year earlier. Single-family homes and condos made up the bulk of the market in roughly equal shares.
Newton Residential Sales and Listings Snapshot
A mixed-unit snapshot of Newton residential sales volume, listing count, and listing composition from the Newton enrollment report.
TOTAL
Residential property sales in 2022 (through Oct 31, 2022)
38%1,096
Residential property sales in 2021 (full year)
52%1,528
Properties listed for sale (Dec 2022)
3%101
Properties listed for sale (similar time last year)
3%98
Percent of listed properties that are single family
47%
Percent of listed properties that are condominiums
50%
Source: MLS PIN / local market listing data, Newton, December 2022.
Low supply explains why inner-core homes tend to move fast. Statewide, homes go pending in around 8 days, according to Zillow data updated 5/31/2026. That's a state-level figure, not Newton-specific, but it signals a market that rewards preparation over hesitation.
There's a meaningful upside to that speed, though: if you buy well, resale demand tends to be strong when you eventually need to move.
Where Does $1M Buy the Most Space?
Move west, and the same budget takes on a completely different character.
In Hampden County, the average single-family price is $382,202. In Berkshire County, it's $399,723. Franklin County sits at $402,194. Hampshire County comes in at $511,634.
Western Massachusetts County Average Single-Family Prices
Compares 2026 average single-family home prices in Hampden, Berkshire, Franklin, and Hampshire counties with how far a $1 million budget stretches in Western Massachusetts.
| Category | Avg. Single-Family Price (2026) | $1M vs. Average |
|---|---|---|
| Hampden | $382,202 | ~2.6x the average |
| Berkshire | $399,723 | ~2.5x the average |
| Franklin | $402,194 | ~2.5x the average |
| Hampshire | $511,634 | ~2x the average |
Source: Crawford Realty Team, Average Home Price in Massachusetts 2026.
This is the clearest answer to the central question:
If your goal is maximum house for $1M, Western Massachusetts wins.
In Hampden County, a $1 million budget runs to about 2.6 times the county's average single-family price. In Berkshire County, roughly 2.5 times. In practical terms, that can mean a larger home, more land, more privacy, or room for multigenerational living — none of which the same budget easily delivers in the east.
It may also mean lower carrying costs. Because property taxes are tied to home value, lower-priced homes often produce lower yearly tax bills. That difference can free up real money for renovations, savings, or simply breathing easier month to month.
The western advantages are strong:
•More square footage for the same money.
•More yard and privacy.
•Lower typical home prices.
•Lower yearly property tax bills on many homes.
The trade-offs are important:
•Boston commutes can be long or unrealistic.
•Transit options are more limited.
•Resale demand may be thinner.
•Price growth may be slower than in the highest-demand eastern markets.
This can be a genuinely smart move if you work hybrid or remote — or if your life is no longer organized around a daily Boston commute. If you value space, quiet, and lower monthly pressure, the west may deliver a better quality of life for the same dollar.
One honest caveat worth naming: slower price growth means your home may build equity more slowly than a comparable inner-core property. If you plan to stay put for many years and care more about monthly affordability and space than maximizing appreciation, that trade-off may be entirely worth it. If you expect to resell within a few years or want your home to work hard as an investment, weigh that appreciation gap carefully before committing to the west.
How Should You Compare Cities Without Getting Misled?
This is where buyers need to slow down.
County averages are a useful broad signal, but they're not the same as city prices. Middlesex County includes very expensive places and more affordable ones. The same is true across other counties. Use the county figure as your starting frame, then narrow down.
If you're comparing Newton to Medford, or Cambridge to Springfield, don't stop at the county number.
Use this three-step test:
1. Start with the county average. This tells you the broad market direction.
2. Check the specific listing's price per square foot. Ask your agent or pull it from a listing site, then compare it against the home's actual size to see how much space you're really buying.
3. Add property taxes and commute costs. This tells you what the home will actually cost to live in.
That last step matters more than most buyers expect.
A cheaper home with a punishing commute may not feel affordable. A smaller home near work can save time, stress, and real transportation dollars every single week.
The best choice isn't always the cheapest home. It's the home that fits your budget, your week, and your long-term plans.
What Are the Strongest Arguments Against This Map?
A fair guide names its own weak spots. Here are the two biggest ones.
Are County Averages Too Broad?
Yes, they can be.
Middlesex County includes high-cost Cambridge and Newton alongside communities with very different price points. One county average can't tell the whole story for every city or street within it.
That's why these county figures are a starting frame, not a verdict. The county average tells you which broad direction your dollar stretches further — east or west. From there, you compare specific listings: their actual size, their actual price per square foot, their actual taxes.
Honest concession: The county-level data here doesn't break down into individual city medians for Cambridge, Newton, or Medford. This guide is built to point you in the right regional direction, not to deliver a finished city-by-city snapshot. Treat the county figures as the starting frame, then check the specific town, street, and listing.
For your wallet, that means one thing:
Don't stop at a headline county average. Confirm it against the actual home, actual square footage, actual taxes, and actual commute before you buy.
Does Western Massachusetts Look Cheaper for a Reason?
Yes.
People pay the Boston-area premium for real reasons: jobs, transit, schools, hospitals, universities, and faster resale. A home in Berkshire County may offer more space, but it may not sell as quickly as a comparable home in a high-demand eastern market.
Pacing data backs this up, though the cleanest figures available aren't for the inner core itself. Statewide, homes go pending in around 8 days, according to Zillow. For a closer look at a fast-moving eastern market, consider Worcester County — a strong commuter market sitting between Boston and the west. There, homes sell for 98–100% of the asking price, meaning sellers rarely have to cut their price. There's also less than one month of supply, meaning very few homes are available at any given time. Both figures come from Annie Oakman of Media Realty Group.
That kind of demand has real value.
If you may need to sell quickly down the road, the inner core and strong commuter markets tend to offer more certainty than a thinner western market.
The west isn't "better" for everyone. It's better if space, privacy, and lower carrying costs matter more to you than fast access to Boston.
Which Massachusetts Market Fits Your $1M Best?
There's no single winner here.
There's only the winner for your life.
Choose the inner core if you're career-anchored. If you need Boston access, strong schools, walkability, and faster resale, the east may be worth the premium. You accept less space and a higher tax bill in exchange for convenience and liquidity.
Choose Western Massachusetts if you're space-seeking. If you work hybrid or remote — or simply want more house and lower monthly pressure — the west may be the better value. You trade commute access and resale speed for room to breathe and, in many cases, slower appreciation.
Real buyers feel this tension sharply. They want value. They want space. They want to avoid becoming house-poor. That tension is exactly why this map matters.
What Is the Bottom Line for a $1M Buyer in Massachusetts?
This isn't a crash. It's a recalibration.
A $1 million budget can mean a modest home near Boston or a major lifestyle upgrade in Western Massachusetts. Same number. Very different outcome.
Before you choose a city, run the full math:
•Purchase price.
•The listing's price per square foot, checked against its actual size.
•Property taxes.
•Commute.
•Resale demand.
•Transfer-tax exposure — the one-time tax owed when a property changes hands — which applies only if your purchase price crosses the $1M threshold.
Same dollar, radically different dream. Let the data — not the assumption — decide where yours lands.
If you want to see how your $1M budget stacks up across the specific Massachusetts cities you're considering, send me your shortlist. I'll help you break down the space, price, tax, and commute trade-offs before you make a move.